


As they prepare for employees returning to the office, many Workplace teams are trying to strike a balance between ramping up their deep cleaning efforts and ensuring the efficiency of their limited cleaning service resources.
Our discussions with customers have centered on three stages of focus:
- What can we do now?
- What does our Day 1 cleaning strategy look like?
- How do we evolve our cleaning strategy post Day 1?
What can we do now?
Most of our customers have implemented a work from home mandate for the majority of their workplace but still have essential workers onsite (security, IT, etc) during this shelter-in-place period. A question our customers are asking: what is the most effective allocation of my cleaning resources, given the reduced staff and limited use of my office space?
They will save as much as 50% in cleaning fees from their previous model of deep cleaning all spaces.
One customer set out to address this question using Density’s real-time occupancy alerts and daily reporting. They used the occupancy data of their spaces to direct cleaning services to high-traffic areas and avoid wasting efforts on spaces that were left untouched. They estimate that they will save as much as 50% in cleaning fees from their previous model of deep cleaning all spaces regardless of use. As their employees return to work, they plan to continue to incorporate Density data to inform their future sanitization strategies.
What does our Day 1 cleaning strategy look like?
Workplace and facilities teams have strategies they are considering, but the definitive picture of the post-shelter-in-place workplace is still evolving. They are actively reviewing recommendations by the CDC, other subject matter experts, and their own understanding of employee behavior and space usage. Density users have an additional input: their historical people-count data.
With our Analytics tool, you can review trend data over pre-COVID months to understand the usage of your spaces. You can use this data to inform where and when you’ll need to prioritize cleaning services and influence new cleaning policies. The following metrics will be especially helpful:
- Occupancy
- Entrances
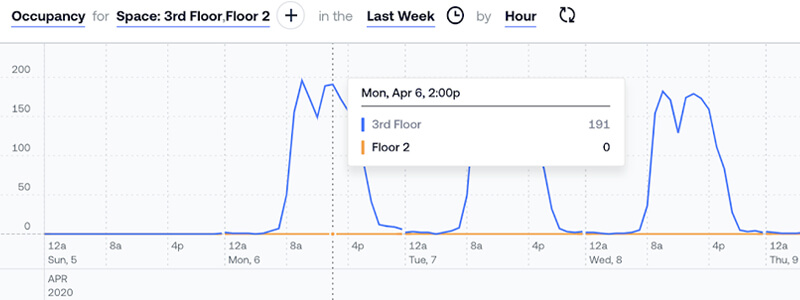
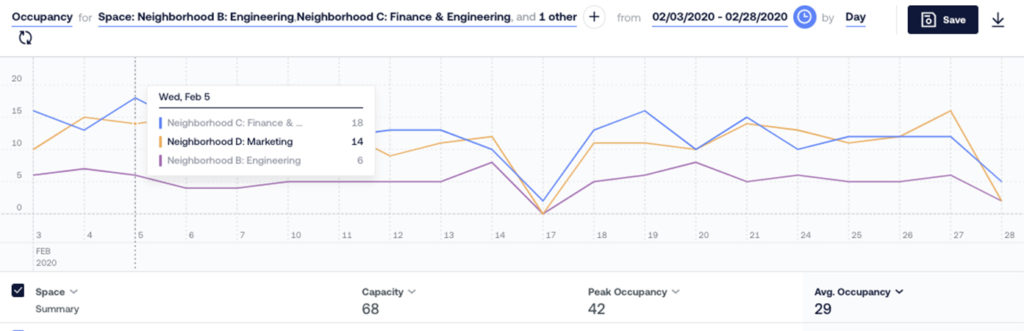
Occupancy data will show which spaces were typically occupied, when, and for how long. You could use this data to determine when to increase air circulation in your spaces or schedule cleaning during office hours for high use spaces.
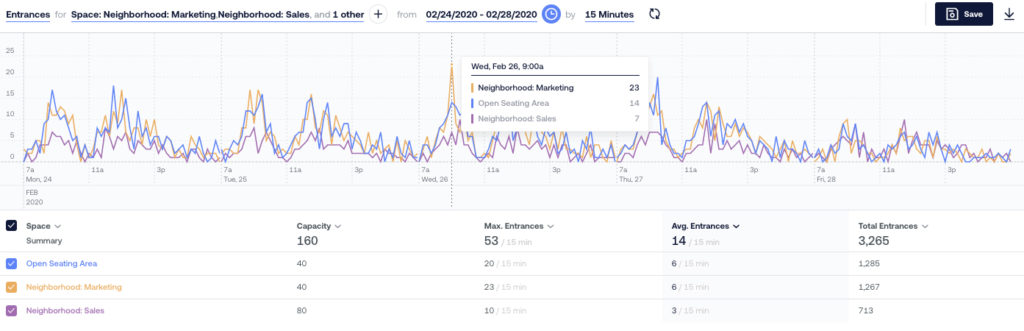
Entrance data will indicate which spaces are the busiest and when. You may consider deploying cleaning services at peak times to these high traffic areas for frequent sanitization.
How do we evolve our cleaning strategy beyond Day 1?
Companies will take different approaches to having employees return from WFH, ranging from employees returning all at once, in phases, in alternating schedules, or moving a portion to permanent WFH. Whatever the approach, Density people-count data can provide you real-time and daily reporting to help your teams be responsive to the needs of employees and to the changing landscape of the pandemic.
Respond in real-time
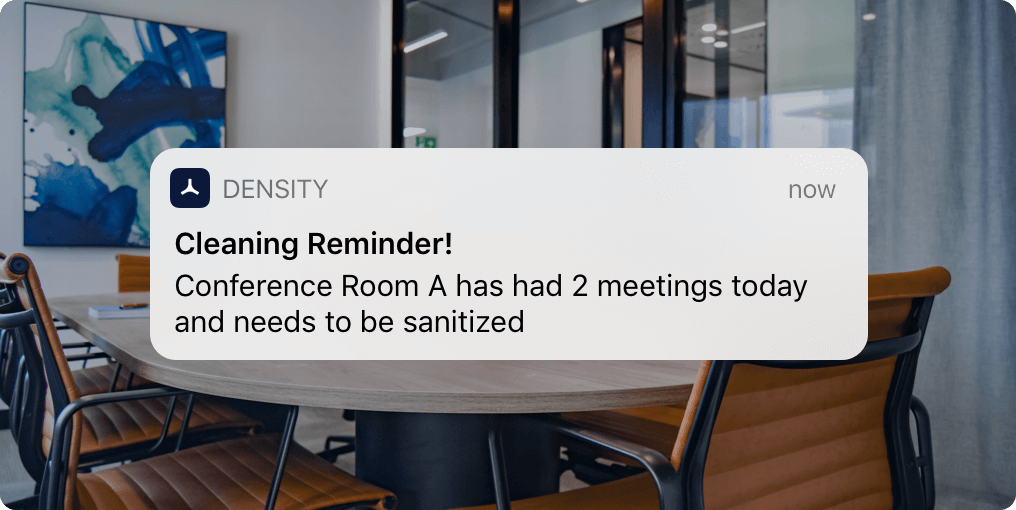
You can set up SMS alerts for your cleaning staff to notify them in real-time when a space has reached an occupancy threshold to inform sanitization priority.
You can set up similar alerts for your Facilities team to know when to increase circulation in a specific space.
Iterate over time
Likely policies will change over time based on what is working for your organization and what is happening in the broader environment. An initial strategy may not be the same as the long-term strategy as people adjust to working back in the office environment. With Density’s reporting and email digests, workplace and facilities teams can utilize data to assess how employees use the space over time. It may be different than it was pre-COVID and this data will help you make more informed decisions on policy updates or changes.