Maximizing workplace ROI with Atlas
Atlas is a fast, fun, and forgiving interface to understand how your spaces perform.

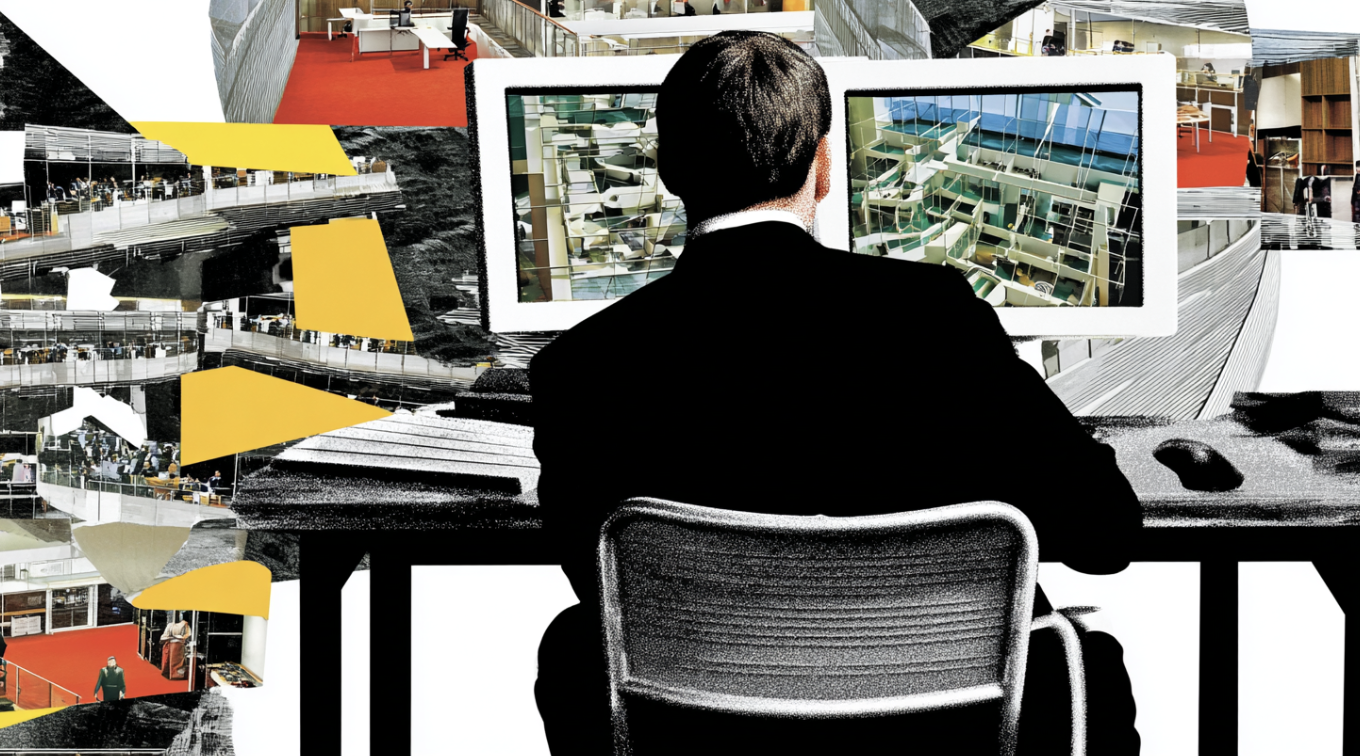
Let's take a deep dive into our platform, Atlas, which makes it easy (and fun?) to understand the ROI of your real estate and workplace initiatives.
Density Atlas is a fast, fun and forgiving interface to understand how your spaces perform. The interface makes it easy to see which spaces are performing well and which ones need more work to get your offices to critical mass. It’s a huge upgrade to the status quo for how teams can bring objective data to workplace decisions.
Check out a quick demo here, or read more below:
Unbundling utilization: time used and density
Atlas exposes two metrics: Time Used and Density. Historically, real estate teams have relied on utilization to understand workplace performance. This is confusing because it obfuscates how long a space was used and how many people used it (”What does 13% utilized mean?”).
Atlas unbundles utilization into 1) how long a space was used during working hours and 2) what was the count when it was occupied? The same space can tell a very different story when you toggle each of these metrics in Atlas: a 12-person conference room can be used 90% of working hours (great 👍) but used by just 1 person (not great 👎). This is an inefficient use of workplace dollars. With Atlas you can find these discrepancies anywhere in a few seconds.
.gif)
An interactive calendar
Atlas reinvents the date picker. We’ve designed the calendar as a visual control: it is both a data visualization and a way to filter time. The calendar days change color to show you what may be interesting or anomalous and you can filter out weeks that don’t matter to your analysis in a few clicks.
.gif)
Labeling
Atlas has the ability to add context to spaces in-line and quickly filter down the view to compare the spaces that matter to you. Teams use this to right-size team neighborhoods for occupancy planning, identify what’s unique about popular open collaboration spaces, and decide on what to invest in for IT equipment.
.gif)
Works with Tableau and SerraView
Atlas is designed for scaled deployments. The system syncs with SerraView to automatically update space names and capacities. It also integrates with Tableau workbooks designed by our industry-leading data & insights team – saving Density customers months of data engineering effort to get to actionable insights.
.gif)
Get started with Atlas today
Atlas is available to all customers with Open Area, the Density sensor that allows you to understand where and how people actually spend their time. If you don’t have Open Area yet, we’d love to chat with you. Later this year we will be bringing data from our Entry sensors into Atlas as well, making it even richer and more insightful.
Key Takeaways

DisruptCRE founder shares how corporate real estate is changing
Companies are moving employees from underutilized offices into "space as a service” options with utilization data.
Watch now
Half of offices are empty but you still can’t find a meeting room
Employees waste up to 30 minutes a day looking for a meeting room to meet in workplaces.
Read moreMost recent
The truth behind “99% accurate” occupancy sensors
Accuracy in occupancy sensing depends on the type of space and situation you’re measuring—not a flat percentage claim.


Privacy and occupancy sensors: 3 practical realities to face
The right occupancy sensors count people while respecting privacy and shielding companies from costly security breaches.

Battery-powered sensors: New hype, same problems
Sensors with batteries decay over time. Learn why real-time occupancy data still demands a wired, scalable solution.
Explore other Density Products
Atlas for Workplace
Insights for the workplace that help you cut costs and deliver better spaces.
Learn more